We are now incorporating micro data to increase the accuracy of our COVID-19 simulation.
Hadean have been modelling the spread of COVID-19, and running large scale simulations to monitor its transmission. These simulations range from the micro scale; the spread through the cells of the lungs, to the macro; the transmission between individuals within a population.
Focussing on how changing factors such as going into lockdown can affect when the ‘peak of infection’ occurs, we designed a visualisation of the macro scale simulation. However to provide better accuracy and reflect the genetic factors of an individual, we’ve now added micro data into the visualisation.
When we look at a virus’ spread there are two important factors: Rt and R0:
- R0 is the reproductive number of virus; chance of virus being spread within a population.
- Rt is the effective reproductive number; realistic rates of a virus being spread between individuals based on current factors of a population, such as transmission rate which can be affected by actions such as wearing a mask.
- It is made up of four parameters: susceptibility, transmission probability, number of contacts an individual has per day and duration of infection.
The macro simulation uses the Rt number to predict if an interaction between individuals would spread the virus. However the value of Rt is constant for the whole population, which isn’t reflective of the real world where individuals can have different levels of susceptibility etc. Therefore Hadean has been using the information from the micro simulation to allow for a dynamic Rt number that accurately represents the population and how COVID-19 would spread.
Analysing the COVID-19 transmission within the cells of the lungs, we can factor in personal traits such as a weakened immune system or respiratory issues. By looking at individual factors we can better understand why some groups are more vulnerable and if the measures put in place need to be personalised, for example. not allowing those with respiratory issues out of the house.
Visualising from Macro to Micro
The macro visualisation used data from the simulation to show the change in the number of susceptible, infected and recovered individuals within a population. By bringing in the micro data we can create groups within the susceptible population which have different values of Rt. Visualising this demonstrates more accurately how a population gets infected.
To understand how including micro data improves the accuracy of modelling we can compare the micro and macro visualisations. Keeping all parameters of Rt consistent apart from susceptibility:
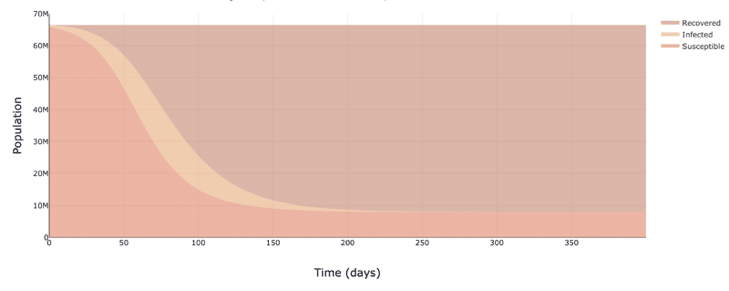
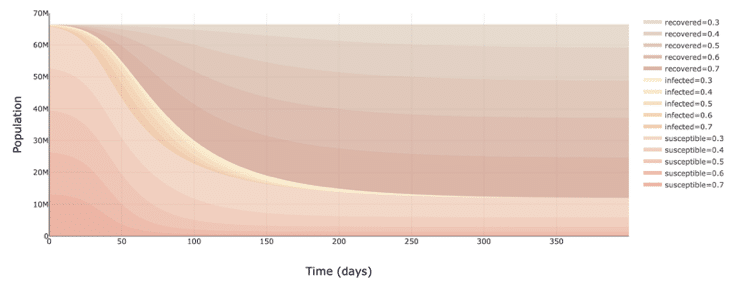
We can see that by factoring in diverse groups with different levels of susceptibility less of the population gets infected than originally modelled and the peak of infection occurs earlier within the pandemic.
Though these changes may seem minor, when dealing with a pandemic accurately understanding the spread is key to lowering fatalities, as healthcare systems can properly prepare.
Further Improving Simulations
We are also working on integrating geospatial networks into the macro simulation, which will provide an even greater level of accuracy as they are able to account for random interactions between people.
We are now incorporating micro data to increase the accuracy of our COVID-19 simulation.
Hadean have been modelling the spread of COVID-19, and running large scale simulations to monitor its transmission. These simulations range from the micro scale; the spread through the cells of the lungs, to the macro; the transmission between individuals within a population.
Focussing on how changing factors such as going into lockdown can affect when the ‘peak of infection’ occurs, we designed a visualisation of the macro scale simulation. However to provide better accuracy and reflect the genetic factors of an individual, we’ve now added micro data into the visualisation.
When we look at a virus’ spread there are two important factors: Rt and R0:
- R0 is the reproductive number of virus; chance of virus being spread within a population.
- Rt is the effective reproductive number; realistic rates of a virus being spread between individuals based on current factors of a population, such as transmission rate which can be affected by actions such as wearing a mask.
- It is made up of four parameters: susceptibility, transmission probability, number of contacts an individual has per day and duration of infection.
The macro simulation uses the Rt number to predict if an interaction between individuals would spread the virus. However the value of Rt is constant for the whole population, which isn’t reflective of the real world where individuals can have different levels of susceptibility etc. Therefore Hadean has been using the information from the micro simulation to allow for a dynamic Rt number that accurately represents the population and how COVID-19 would spread.
Analysing the COVID-19 transmission within the cells of the lungs, we can factor in personal traits such as a weakened immune system or respiratory issues. By looking at individual factors we can better understand why some groups are more vulnerable and if the measures put in place need to be personalised, for example. not allowing those with respiratory issues out of the house.
Visualising from Macro to Micro
The macro visualisation used data from the simulation to show the change in the number of susceptible, infected and recovered individuals within a population. By bringing in the micro data we can create groups within the susceptible population which have different values of Rt. Visualising this demonstrates more accurately how a population gets infected.
To understand how including micro data improves the accuracy of modelling we can compare the micro and macro visualisations. Keeping all parameters of Rt consistent apart from susceptibility:
We can see that by factoring in diverse groups with different levels of susceptibility less of the population gets infected than originally modelled and the peak of infection occurs earlier within the pandemic.
Though these changes may seem minor, when dealing with a pandemic accurately understanding the spread is key to lowering fatalities, as healthcare systems can properly prepare.
Further Improving Simulations
We are also working on integrating geospatial networks into the macro simulation, which will provide an even greater level of accuracy as they are able to account for random interactions between people.