This is the story of the first step of WASM at Hadean (complete with an interactive demonstration of the result).
One project that caught my interest 5 years ago was Emscripten, a set of tools and scripts that claimed to allow you to compile C and C++ projects to run in the browser. It seemed pretty cool, but I didn’t really write C or C++ at the time so it didn’t seem relevant to me.
Add a few years and some C experience and I’d picked up a hobby to put code in the browser – Python, Tcl and (in a stroke of inspiration or madness) I combined the two and wrote a Tcl bytecode decompiler in Python, with a nice web interface to show the steps of decompilation. Along the way I contributed a fair amount back to Emscripten and experimented with some larger projects, but eventually I got interested in other things – my current job at Hadean and the Rust programming language (which ended up aligning nicely, since we use Rust at Hadean).
The ‘compile languages to the web’ scene has changed a lot since then, moving from asm.js (an easy-to-optimise subset of Javascript) to WASM (a binary format with a standard, designed as a compilation target for the web) and involving other languages like Rust – I figured it was time to resurrect my hobby!
Background
Hadean, founded as a general distributed computing company, has recently been focusing on the applicability of our technology to simulations. We’ve had some exciting traction in the multiplayer gaming space this year with the idea of spatial partitioning (splitting up space onto different cores or even servers) and have created a few flashy demos to give some hints at what might be possible – check them out here.
However, if you’re the operator of a game (or a developer at Hadean!), the beautiful graphics aren’t of so much interest – you’re probably looking for something intended for debugging so you can see exactly what’s going on behind the scenes.
Enter the debug client!
The debug client is a program written in C++ (we figured customers in the video games industry are more familiar with C++ than Rust) and using OpenGL for exactly this purpose and you can see a screenshot of it (inspecting the spaceships demo) here:

Note the presence of cell boundaries (one per core here), with cells of different colours representing multiple servers. It’s currently at an early stage of development and we anticipate adding much more functionality to it in time.
However, although both extremely useful and a great example integration with a simulation backend, there are downsides – being a native program means you need to have it compiled and on your machine to benefit from it. Unfortunately, OpenGL can be challenging if you want one binary to work for everyone, and we’ve not really explored putting it on OSX or mobile devices. It’d be much better if we could let anyone with a web browser make use of it.
The Road to the Web
This has obviously all been leading up to me dusting off my Emscripten skills to try my hand at putting our debug client on the web. The strategy I generally follow with Emscripten conversion projects is to get something converted as quickly as possible to check it’s even viable (things like inline assembly can quickly ruin your day), and then come back to clean up later.
The points I’ll cover are the approximate steps I took on a Linux machine to get as quickly as possible from zero to web (it ended up taking two days). Some steps won’t be too pretty, but my experience suggests that it’s a fairly effective way to operate during an initial conversion.
Make it Compile
Step one for me in any Emscripten porting project is actually making it compile – you’re not going to get very far otherwise!
The Emscripten documentation about building projects is a good read, but the key thing we’ll be working with here is em++ – the Emscripten C++ compiler. em++ operates very like the command line of a normal C++ compiler (specifically Clang) and accepts many of the same options.
In a normal project, compilation looks a bit like this:
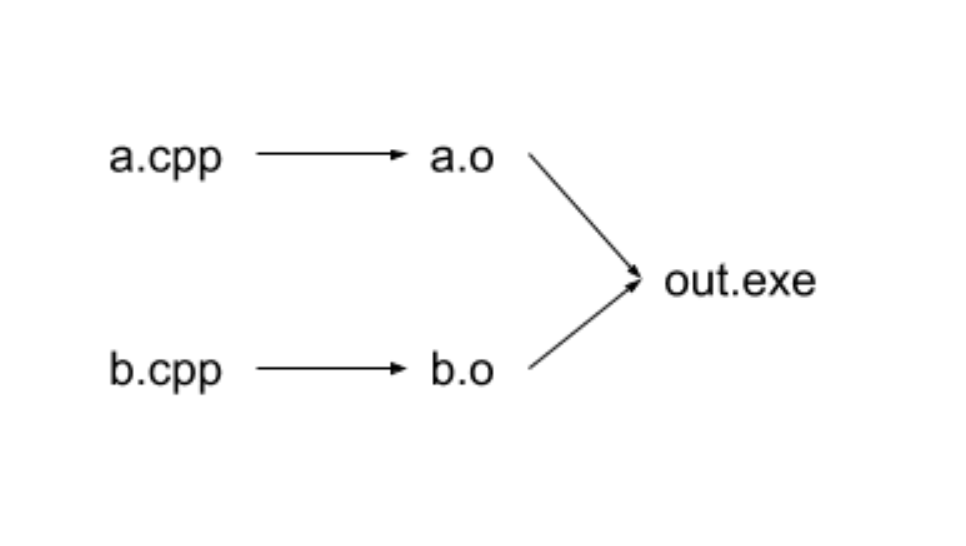
With Emscripten it looks like this:
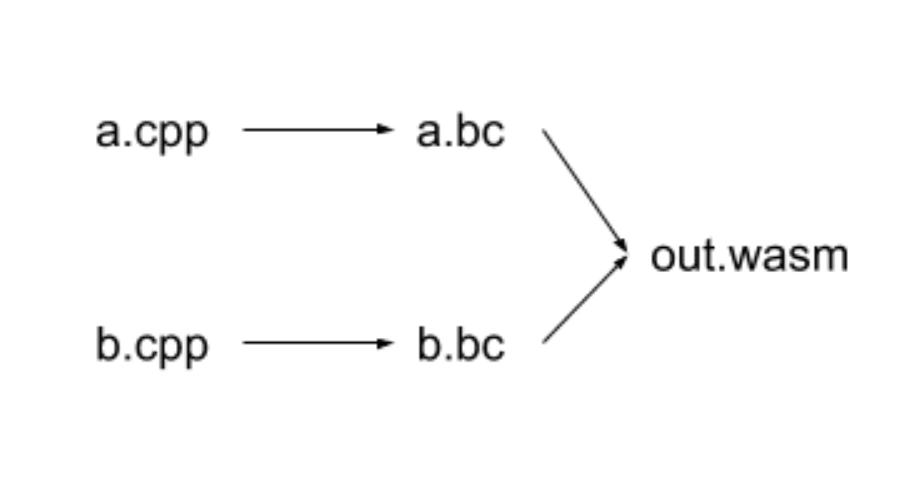
The .bc files in an Emscripten compilation can actually end with .o, but they are still ‘LLVM bitcode’ files under the hood – we’ll refer to them as object files.
Creating Object Files
The first step of compilation, from a .cpp to an object file is generally when you need to start changing your source files to work with the Emscripten world. If you have some way to configure your build, try disabling as many optional features as possible to make your life easier and accelerate this first step.
In the case of the debug client there were two main areas of focus.
First, sizes of integers – many modern machines are 64-bit and unless you’re explicitly testing 32-bit machines or being very careful about assignments, it’s easy to treat a uint64_t and a size_t as the same thing:
e.g. std::min(s->cur_header.len, msgbuf->buf.size() - msgbuf->len);
In this case the two len fields are a uint64_t, whereas size() returns a size_t. Problems like this are easily solved with careful insertion of casts, but you’ll need to stop and think about your types.
Second, conditional compilation and ifdefs – this is much less of a problem than one might expect when porting to a new platform, as Emscripten includes some fairly impressive compatibility machinery to make it look a lot like Linux on the syscall level. If your program is designed to be cross compiled and so already contains ifdefs, a good start is to convert all #if defined(__linux__) to #if defined(__linux__) || defined(__EMSCRIPTEN__).
This won’t solve everything (some very Linux-specific headers just aren’t available to programs being compiled with Emscripten) but it’s a great start and was all I needed for the debug client.
Once you’ve finished tweaking your source files, you can typically build the vast majority of your project with a normal build system by overriding the C++ compiler. This will produce the majority of your object files, and bring you to…
Linking final program output
Now all the object files are created, it’s onto the link step – in normal compilations (per the diagram) this would create my debug client executable. In the Emscripten world, it’s going to produce a WASM file (and a few other pieces like a .html and .js file to let me quickly open up the final output and give it a try).
If you have all of your object files and dependencies ready, linking should be a pretty straightforward step with no errors at all. Unfortunately, it is very rare that an Emscripten port actually has all the files ready – libraries already on your system cannot be used to create your .js file and so Emscripten will ignore them.
Emscripten is quite permissive by default here, just giving you warnings – first when it says “you mentioned library foo on the compile command line, but I can’t find it” (e.g. the link command line includes -lfoo) and then “there’s a function foo_function you look like you need, but I couldn’t find that in any of the libraries” (e.g. because your code at some point calls foo_function, but the command line doesn’t include -lfoo).
My recommendation at this point is to pull the exact link command from your build system and paste it in a file somewhere, as you’re probably going to be fiddling with it quite a bit.
First I set the EMCC_STRICT environment variable to be 1 and added -s ERROR_ON_UNDEFINED_SYMBOLS=0 to the linking command line (making sure you’re performing the link with the emcc command). The first disables some deprecated Emscripten features and disallows missing libraries mentioned on the command line, and the second explicitly permits undefined symbols as I use them later. I then worked through errors caused by missing libraries, noting down their names and removing them from the link command line.
Eventually, I ended up with a ton of warnings about unresolved symbols, but something that compiled! Hooray!
Resolving undefined symbols
After removing all libraries that Emscripten couldn’t find, I ended up with a long list of warnings, partially reproduced below:
warning: unresolved symbol: glfwCreateWindow
warning: unresolved symbol: glfwDestroyWindow
warning: unresolved symbol: glfwGetFramebufferSize
This isn’t a big surprise – the debug client uses some OpenGL libraries, but I just removed some of them from the link command line because Emscripten couldn’t find them! Fortunately Emscripten offers support for a number of popular libraries, both via ‘ports’ (where Emscripten will fetch and build the code for you) and via compatibility layers implemented directly in Javascript.You can find the most up-to-date list of ports (at time of writing at https://github.com/kripken/emscripten/tree/bc43482/tools/ports), but the compatibility layers are much tougher to get a comprehensive list of – some of them are magically enabled by link flags (e.g. -lGLEW, necessary for glewInit, didn’t need removing from my link command line because it enabled one of these compatibility layers), while others are enabled by src/settings.js.
src/settings.js is an absolutely crucial file when building Emscripten projects – it contains the vast majority of configurable options for Emscripten and I generally scan over it whenever starting a new project. It bore fruit this time in the form of -s USE_GLFW=3, which then allowed me to add -lglfw to my link command line, eliminating most of my undefined symbols (leaving a lot of gl* symbols).
Bear in mind that there’s no need to fix all unresolved symbols! If you know a codepath isn’t going to be used, you can just ignore warnings about some symbols. Or you can just continue to other things (as I did at this point) and come back later.
Connecting to a simulation
Now I’d built the client, it was time to give it a try!
Some background: the debug client connects to the simulation by establishing a TCP connection to a single endpoint and receives all cell state updates from there. For the purposes of this experiment I simply hardcoded the host and port to connect to (IP address 127.0.0.1, port 8881) in the C++ code.
Moving past an easily resolved error with connect (Emscripten always returns EINPROGRESS regardless of socket blocking mode – treating an EINPROGRESS error code as success was good enough for me), I came across a tougher error to resolve:
Firefox can’t establish a connection to the server at ws://127.0.0.1:8881/.Browsers cannot establish TCP connections and so Emscripten does the only sensible thing it can – TCP streams are wrapped inside websocket streams. Unfortunately this means my web client is no longer compatible with the simulation state endpoint. Happily, there is a solution – websockify, a tool that “translates WebSockets traffic to normal socket traffic”!
Running websockify with ./run -v 9881 localhost:8881 (listening on port 9881 and forwarding to localhost on port 8881) and altering the hardcoded port to be 9881 gets the simulation past that point (seeing the connection into the simulation on the backend) and presents me with…a black screen.
The Curse of OpenGL
So we have the code compiled, it starts up, connects to the simulation and displays nothing. It does give errors in the console though!
A side note: my OpenGL experience before Hadean was precisely nil – it caused some amusement in the office when we realised that we have operating system developers, a programming language theorist, someone with experience with robotics and embedded systems, and yet the person highest in the stack (me) knows the least OpenGL. My knowledge is still woeful and I moved forward with this project with a lot of fumbling around – this section will be very much a summary.
Anything graphical is often where things get tricky with Emscripten, and there are a whole host of options that I reach for on a regular basis, including but not limited to:
-s ASSERTIONS=2– a vital tool to figure out where things are going wrong. Even in ‘production’ builds I’ll keep this at 1 despite the significant performance overhead.-s WASM=0– disabling WASM (in favour of asm.js) gives you much better stack traces and the ability to easily go digging around in the code (and tweaking it!).-g2 -O1– a reasonable mix of debuggability (function names preserved) and acceptable performance. Using-g3is even better (preserves variable names) but going too far down the ‘debuggable and not-optimized’ route has previously left me with 700MB Javascript files – not recommended.-s GL_DEBUG=1 -s GL_ASSERTIONS=1 -s TRACE_WEBGL_CALLS=1– useful graphics-specific settings to try and extract more information from issues (the last one causes significant verbosity and slowdowns, so only enable when necessary).
I highly recommend reading the previously mentioned settings.js file and the output of emcc --help to get a picture of the possibilities available to you.
A sane first step was to come back to the unresolved gl* symbols Emscripten was still warning about, as they’re definitely required.
Reading the documentation for Emscripten OpenGL support, an FAQ about desktop support pointed me to ‘Regal’, a project that offers “a user-space OpenGL layer for OpenGL 2.x, 3.x, 4.x, Core contexts and ES 2.0”. Thinking it would magically provide compatibility I wasted a fair amount of time on it. I would not and would not recommend it unless you a) understand (and want) what it’s offering to the extent you could build it yourself and b) enjoy hacking on out-of-date projects.
Giving up on Regal, I decided to just do all the required conversion myself.. Although initially I used -s USE_WEBGL2=1, this broke compatibility with Edge and Safari so I stuck with the default of WebGL version 1. Eventually I realised that OpenGL ES2 (the technology WebGL is based on) and OpenGL 4 are very different beasts (OpenGL ES2 and WebGL also have differences, but let’s ignore that for now):
- OpenGL novices should read https://www.khronos.org/opengl/wiki/Shader_Compilation, but the short of it is that the way you build the overall rendering pipeline is very different on the web (where you add some shaders into a ‘program’) vs the desktop (where you add one shader per ‘seperable’ program, and combine programs into a pipeline). If you have any mentions of
glGenProgramPipelinesorglBindProgramPipeline, you’ll need to rewrite some code. - The shader language is quite different (for readers unfamiliar, OpenGL shader language is a C-like syntax that gets compiled (yes, even in browsers) into shaders). You need to target a different shader version, you seem to need to declare the precisions of datatypes, the way of specifying shader parameters can differ…the list goes on.
- A number of
glEnablecapabilities are missing, some quite important! Of note for the debug client wasGL_DEPTH_CLAMP, which I emulated in-shader with the help of https://stackoverflow.com/questions/5960757/how-to-emulate-gl-depth-clamp-nv
Getting debugging information can be extremely painful in the browser and it’s not always clear my conversion was incorrect or I was hitting an incompatibility. I found that checking in the native debug client (with heavy usage of glDebugMessageCallback) streamlined the conversion process massively.
After about a day of shader rewrites, compatibility hacks and pain (half of the time spent on this project in total!) I ended up with something appearing in the browser:
This is obviously not what I was looking for! Checking the native client (which I had maintained to be working through judicious #ifdefs) showed it all fine, so what’s wrong? Turns out, I still had -s WASM=0 set. Although I didn’t dig deep enough to verify, my hypothesis is that the inexact nature of Javascript numbers caused this very odd behaviour.
Switching back to using -s WASM=1 (the default) gave me working output! The following video shows me inspecting a live simulation of a few thousand spaceships in a battle.
Additional Notes
So – it compiles, it connects, and it displays! All done?
There were some additional pieces of note that I skipped in the recounting above:
- The debug client uses some x86 extensions via
immintrin.h– passing-msseat link time tells Emscripten to use ‘SIMD.js’. - Usage of strict mode means I added
-l sockfs.js -l gl.jsto the link command. - Essential for any graphical Emscripten project, I converted the main loop to use
emscripten_set_main_loop, which uses the browserrequestAnimationFrameto prompt the redraws. - There is a small amount of threading in our debug client at the moment, so I used
-s USE_PTHREADS=1at link time. Unfortunately shared memory is not considered safe for use (due to security issues) in any browser, so I enabledjavascript.options.shared_memoryin Firefox (I disabled the threading for the demo at the bottom of the page, so no need to change any browser settings). - As is fairly standard (for me), I’m using
-O3 --llvm-lto 3and bumping the-s TOTAL_MEMORY=...setting.
In conclusion
My conversion was a success and we can now use the same codebase for both a native and in-browser client!
And as a bonus, I recorded 30 seconds of a small simulation (1000 ships and a sparse asteroid field) for you to replay at your leisure! The simulation actors will halt after the recording is over, but you can continue looking around, or restart the recording.
You can use the arrow keys to fly around (or the mouse wheel to move faster), ctrl to descend, space to ascend and the mouse to rotate your view around the origin (we realise the controls are odd – the debug client isn’t where we’re putting our gameplay efforts!).