The first stage of preventing disease spread, is to look at how it spreads through a population. In partnership with the In partnership with the Francis Crick Institute and Imperial College London, Hadean have been using Hadean Simulate (previously known as Aether Engine) to build agent-based simulations for COVID-19 data visualisation.
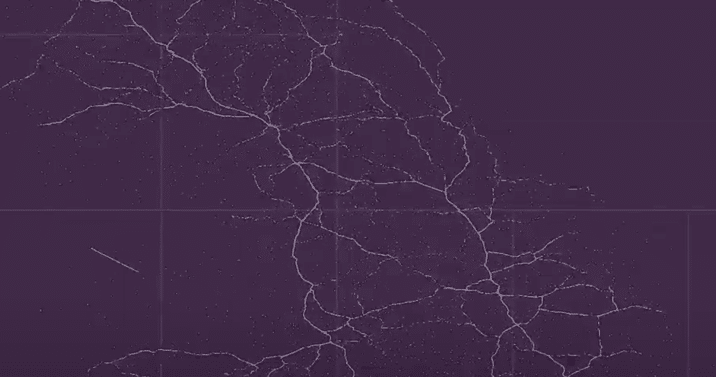
These simulations are looking both at the micro-scale; simulating the spread of COVID-19 around the lungs. And at the macro scale; simulating the transmission from person to person along the transport network of the UK. Together, the simulations can provide an accurate understanding of the spread of COVID-19.
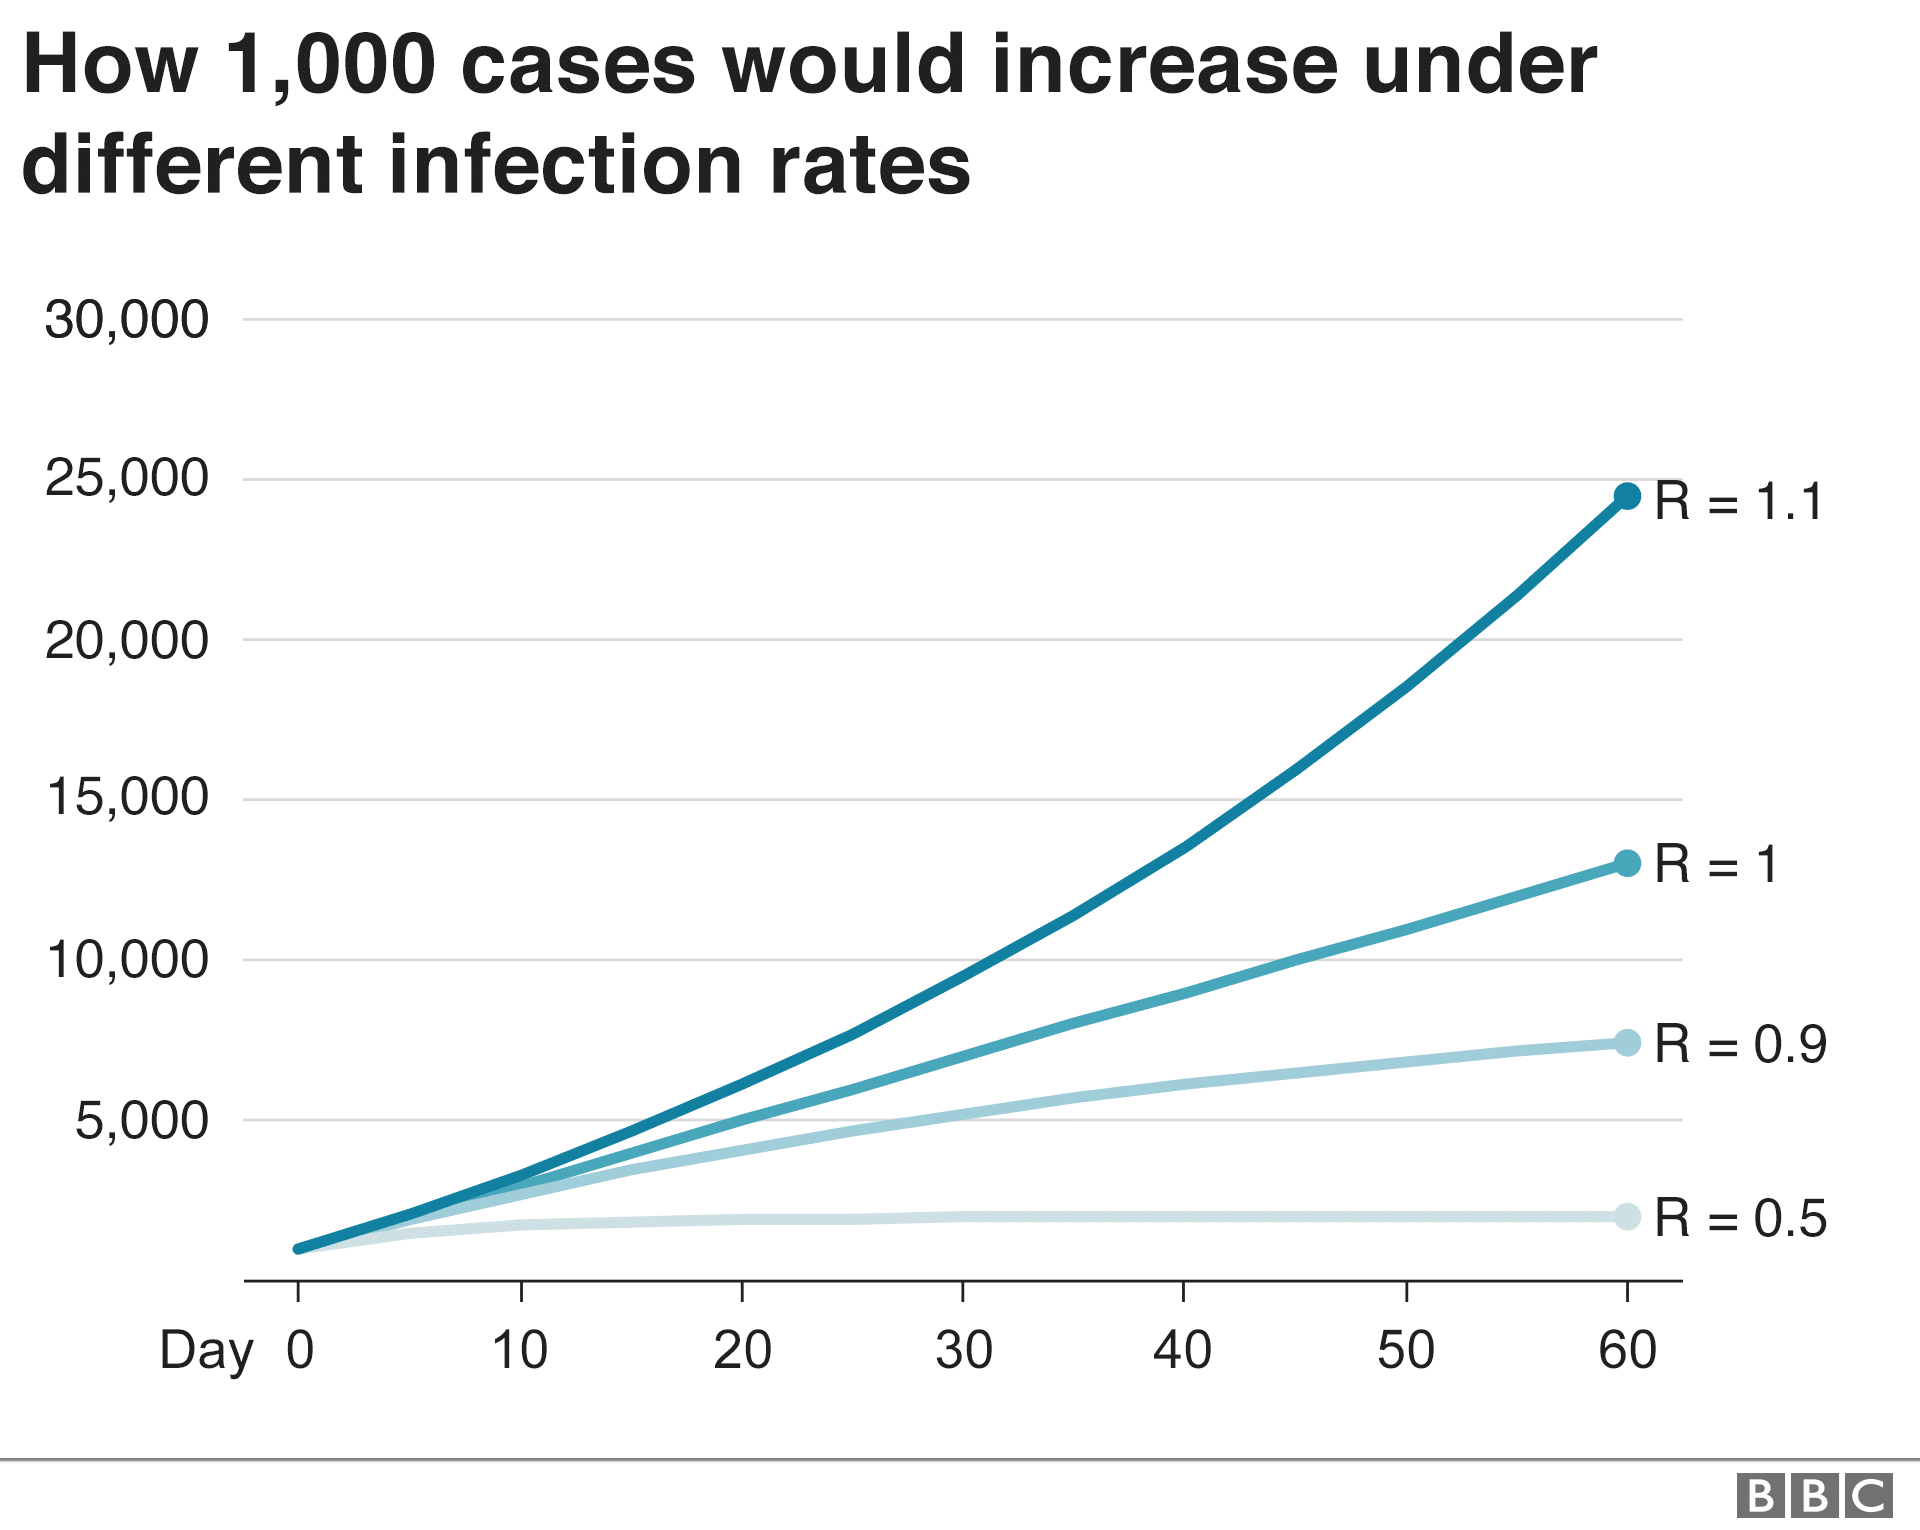
To help us better understand how changing the R value can affect the rate an infection spreads within the macro scale simulation, there are various visualisations we can use, for example, this interactive graph which we will discuss in greater detail below.
Macro simulation
The large scale macro simulation is not only important to have an understanding of how quickly a disease spreads through a population, but also how different intervention methods can slow the spread of disease. By changing the parameters of the R value, which is a rating of disease’s ability to spread, we can see the effectiveness of measures such as using masks to lower the transmission rate of a disease or placing the country in lockdown to limit the number of contacts per day.
To easily see how the number of infected individuals changes when using different parameters, we built an agent-based simulation to observe the non-obvious behaviour that emerges as the infection spreads.
Graphing the data could help provide valuable information such as when the peak of infection might occur and can help us inform when it is safe to remove certain measures, or whether removing certain measures too early could cause a second wave of infections (due to there still being too many susceptible individuals and too high number still infected).
Data visualisation
We have created a simple graph indicating how different factors might affect the spread of a disease and how the number of infected, susceptible and recovered individuals changes over a period of time based on these factors.
Making the macro simulation more accurate
Hadean are working with Imperial College London to integrate geospatial social networks into the macro agent based model of transmission in the UK. By incorporating social networks with a spatial component, we can help understand spread better, as Geospatial networks can model for disease transmission between socially connected groups (e.g. work colleagues) whilst also taking into consideration population density and ‘random’ interactions based on spatial proximity.
Looking forward
Hadean are now looking at building the micro scale (modelling transmission between cells in the lungs) into the macro scale which will help increase accuracy as it will incorporate an individual’s genetic factors such as immune weakness. Understanding how genetic factors might impact the speed in which viruses spread will help us quickly decide which intervention methods are suitable (such as shielding those who are more susceptible to the virus) as well as when it is safe to lift these measures.
The recent pandemic has highlighted that without quick and accurate modelling methods to help us understand the spread of the virus, we cannot effectively limit fatalities. If simulation is the only tool we have that can project hypothetical outcomes of a given situation, it is vital that these can be built and scaled rapidly, so decisions can be made in a timely manner to save lives. It is also vital that these simulations can be quickly rerun as new data emerges and our understanding of the situation evolves.
Hadean Simulate’s cloud-nativity enables simulations for data visualisation to be scaled quickly and easily, enabling scientists to respond at speed too rapidly changing circumstances.